Updated July 5, 2023
When the world around us, and the workplace especially, is becoming more and more digital one might assume that the transformation is ongoing and everyone onboard. But is that really the case? Are people in your organization really embracing the new digital ways of working? Do they have effective meetings online? Are they using modern chat-based communications to increase transparency and speed up delivery times?
To get a better understanding of how well employees in your organization are using the applications in Microsoft 365, and to see how your organization is comparing to peers, it’s a good idea to keep track of your company’s Adoption Score.
What is the Adoption Score?
The Adoption Score (previously known as Productivity Score) is a numeric metric from 0-800, automatically calculated for your organization based on the digital behavior of your employees and the quality of your IT infrastructure. Your adoption score is then translated into a percentage from 0-100 %. An example of end-user behavior could be if people share documents by sending them as attachments or if they share links, if they turn their camera on in meetings or not, or if they use channels in Microsoft Teams for their communication or only chat.

An example of the quality of your IT infrastructure could be network connectivity. Is the Internet connection stable for your users, or does it sometimes go down? In addition to your own organizations’ calculated score, you can also see a peer benchmark score, which is the average adoption score for other organizations similar to yours.
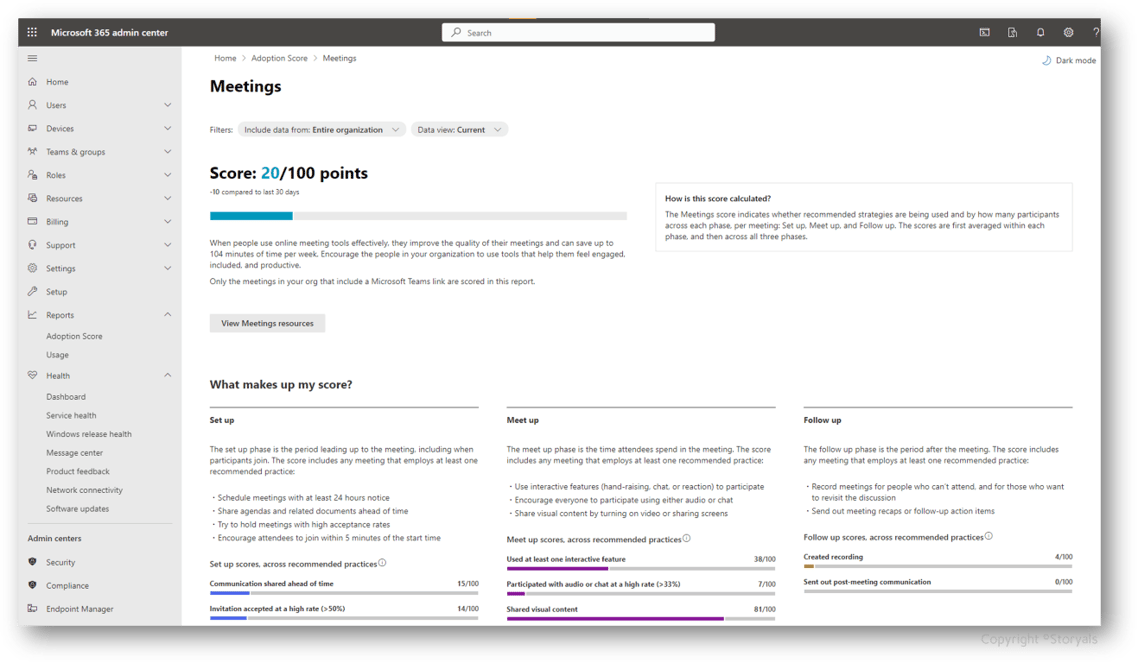
In addition to the actual Adoption Score, you can see a full report with details under various categories – Communication, Meetings, Content collaboration, and so on. You will see charts showing for instance what percentage of your users have their camera on in meetings. When Microsoft first launched the Adoption Score Report, it showed details of usage on an individual level. Due to privacy considerations, this has been changed so that all usage data is shown on an aggregated level, which gives organizations a good overview on digital transformation and behavior within the organization.
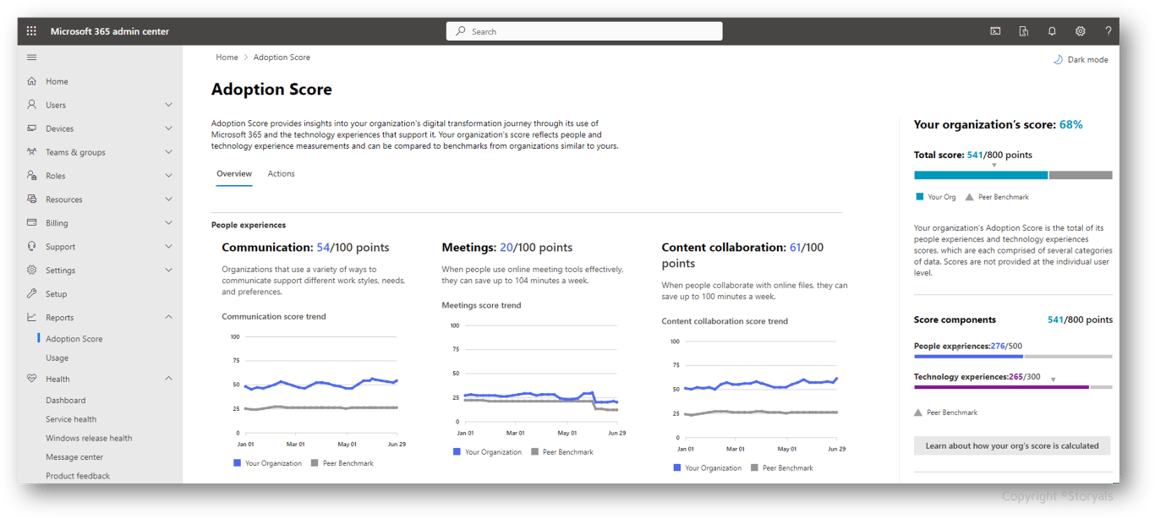
In June 2023, Microsoft announced additional capabilities in regard to the Adoption Score report, such as being able to filter by Country/City/Department and the ability for Administrators to send out targeted messages to end users to encourage and drive adoption.
How do you access the Adoption Score Report?
The Adoption Score Report is available in the Microsoft 365 Admin center, under "Reports". Only users with specific IT permissions can access the report. If you are a normal business user, it is unlikely that you have been assigned such permissions. If you work as a Change Management Lead, within Learning & Development, or as a Business Manager within IT, we strongly recommend that you request from your IT department to get access to the Adoption Score report by getting a Report Reader role assigned to you. You can learn more about the permissions required here.
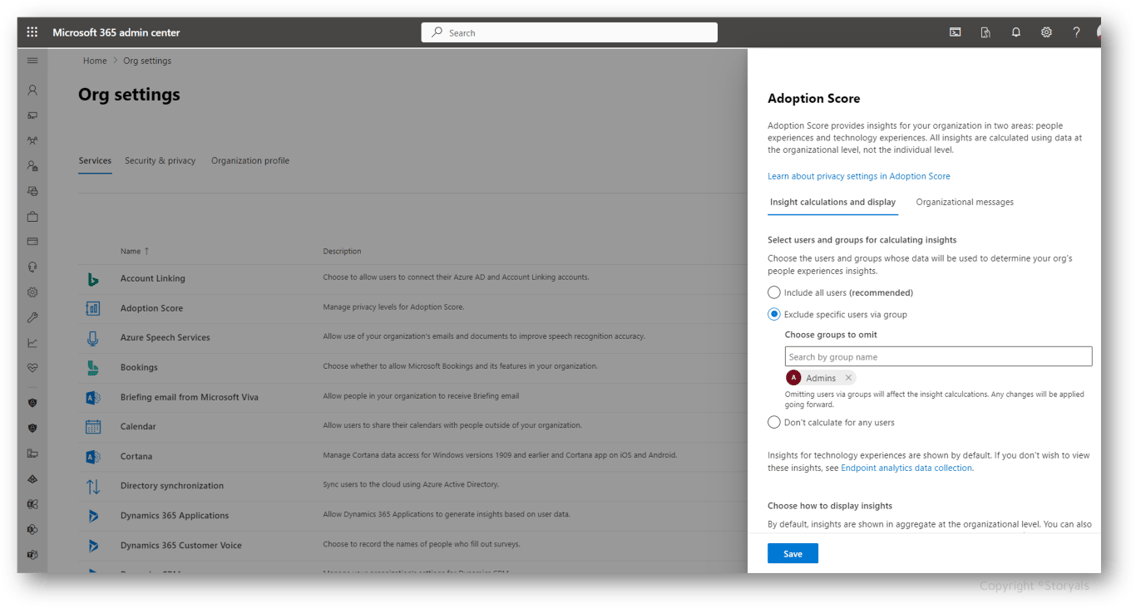
We recommend that you fine-tune the Adoption Score Report by changing the settings so that you only capture data from users that you are interested in (such as your internal employees).
The settings of the Adoption Report are accessed by going to Org Settings - Adoption Score - Insight calculations and display. Here you can also select to turn on Group Level Insights.
Best practices using the Adoption Score Report
Ok, so say you have gone through the hassle of getting your hands on the report, then what? What can you do with it? First, it’s important to understand that the report and the score is not a fully accurate picture of reality. For instance, in our organization, we share a lot of documents externally via sharing links, but this is not reflected correctly in the Storyals Adoption Score Report. Even so, the Adoption Score is a good data point and benchmark for you to measure the impact of your adoption activities and training program results. At the end of the day, increased adoption leads to increased productivity - and increased return on the investment in Microsoft 365 for your organization.
The recommendation is to see the score as an overall indicator of your organization’s productivity and not the absolute truth.
Use the adoption score as one data point (of many) that you can use to analyze and track your organization's digital transformation journey over time. Since the report only shows you 6 months’ worth of data, we recommend you monitor the development and keep a record of the progress. We recommend our customers do a quarterly check of the Adoption Score Report to see that the development is going in the right direction.
Would you like to understand what you can do to increase the overall productivity of your organization?
At Storyals, we offer an Adoption Score increase guarantee to all our customers. Reach out to us today to learn more!